B.13 Copper Basin Mine Case Study
Contacts
Mark Bowers, CIH #
919-552-9675
[email protected]
Ben B. Falkner
304-920.0627
[email protected]
Scott Deal, P.E.
423.496.7900
B.13.1 Name, Location, and Site Description
Copper Basin Mining Site is in the Lower Potato Creek Watershed near Ducktown, Polk County, in southeastern Tennessee near the North Carolina and Georgia borders. This site is approximately 50 square miles and lies adjacent to lands administered by the Cherokee National Forest (Figure 1-1). The Copper Basin, north of the Ocoee River, is drained by North Potato Creek and Davis Mill Creek, which empty into the Ocoee River.
The basin has been host to 150 years of copper mining, beneficiation and mineral processing, sulfuric acid, and other chemical production that have left a legacy of environmental degradation. Deep mining was the primary method, with a few surface-mining operations. In addition to mining and related operations, associated support infrastructure (railroads, equipment storage, and other waste processing facilities) can be found throughout the basin. Remnants of these mining practices remain scattered throughout portions of both North Potato Creek and Davis Mill Creek watersheds. The affected media are soil, sediment, surface stream water, surface pool water, and groundwater.
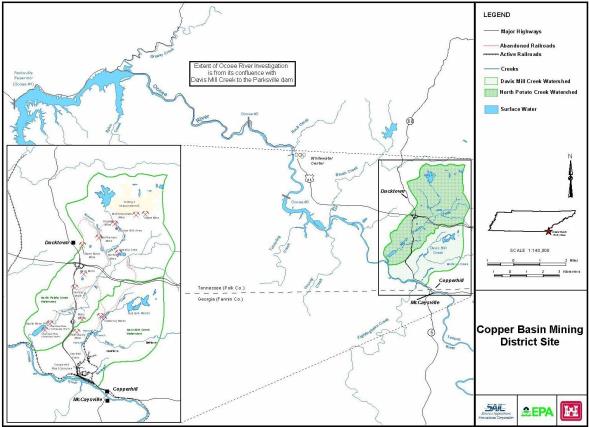
Figure B.13-1. Copper Basin Mining District.
Before remediation efforts, the site contained extensive acidic drainage with aluminum, copper, iron, manganese and zinc as the primary contaminants. Secondary contaminants include arsenic, cadmium, cobalt, copper, lead, mercury, selenium, and sulfate. Remedial actions at the Copper Basin Project by Glenn Springs Holdings, Inc. (GSH) are regulated by USEPA Region 4 Superfund and Tennessee Department of Environment and Conservation under its Superfund Voluntary Cleanup Oversight and Assistance Program. The site cleanup goal is mitigation of human health risk and ecological risk in the stream environment and is evaluated using load reductions in contaminants in selected streams, supplemented by performance goals of establishment of diverse benthic macroinvertebrates in North Potato Creek, establishment of vegetative cover on reclaimed waste areas, and establishment of fish and amphibians in wetlands in certain water bodies at the headwaters of North Potato Creek. Lower North Potato Creek watershed restoration has been addressed using the adaptive management process. Adaptive management involves well-reasoned iterative actions accompanied by comprehensive monitoring to assess progress toward quantitative objectives and facilitate subsequent remedial decisions. Specifically, GSH has sequentially 1) characterized drainage and influences, 2) diverted unaffected drainage, 3) captured and chemically treated affected drainage, 4) sequestered acid producing materials, and 5) mitigated remaining problems with passive systems (both wetlands and biochemical reactors).
In 1998, GSH removed obvious waste material proximate to a first order stream and diverted the base flow from the stream via a concrete dam to a two acre anaerobic wetland outside the flood plain. This was necessary since the vegetative cover in the watershed had not yet achieved stability and erosion and sediment load during storms was significant. The wetland has treated base flow (~300 gpm) of McPherson Branch since that time and has removed all acidity, provided alkalinity, and substantially reducedIn chemistry, having gained electrons. Often gaining electrons is accompanied with gaining protons (hydrogen). As an example, when O₂ reacts with H₂, the oxygen is reduced, forming H₂O. iron, copper, manganese, and zinc. The wetland was supplemented with three aerobic wetlands and a manganese reducing rock filter in 2003. A restored stream segment was added to the drainage before it returned to the receiving stream as part of the demonstration effort to learn more about the challenges facing re-establishment of diverse aquatic life in the dramatically impacted habitat.
Reaches of some receiving streams failed to meet macroinvertebrate performance goals after diversion of affected drainage and removal of evident waste materials. Some reaches recovered after these efforts, but others required more extensive removal of tailings and waste materials and reconstruction of nearly one mile (1600 meters) of second order stream. During impaired stream sediment and waste removal efforts, all acid forming materials were removed from the site, and “compost vaults” were installed in moist areas where either waste materials or their influence had the potential to contribute poor quality drainage. These small biochemical reactors differed from the McPherson Demonstration Wetland in that post reclamation water quality within the reclaimed area (now interstitial groundwater seepage to the restored stream) was not characterized before or after the installation of the many compost vaults placed proximate to the restored stream banks. The efficacy of the remedial efforts can be attributed to the combined efforts of the five pronged sequential approach described in the first paragraph, but the specific contributions toward improving water quality from the compost vaults cannot be isolated or quantified. At other locations, waste was removed and compost vaults installed that drained to the receiving stream without substantial in-stream removals or habitat enhancement.
B.13.2 MIW Chemistry
Drainage to McPherson Branch from undisturbed metal laden strata and mine waste placed along transportation corridors and remaining at roasting yards and processing areas caused the stream to contain metals and associated acidity that exceeded established water quality criteria. The pH was steady at ~4.2, with ~ 30 mg/L acidity, and the total iron, manganese, copper, zinc, and aluminum concentrations were 7.0, 1.2, 0.6, 1.7, and 4.2 milligrams per liter (mg/L), respectively. This drainage was diverted to the McPherson Demonstration Wetland in 1998, and with the addition of aerobic wetlands and rock filters in 2003 to supplement the original two acre aerobic wetland, effluent drainage has since been alkaline with pH > 6.5 and all metals (with the exception of zinc during very cold weather) less than water quality criteria. Drainage to the receiving stream bypasses several hundred linear feet of stream that has since been excavated and restored with non-acid producing materials and supplemented with cobbles and graded substrateEither (a) a chemical which reacts or (b) a solid surface or (c) an electron donor.. Moist areas that might contain residual waste materials (or their influence) after removal of obvious sources within the stream corridor were excavated and “compost vaults” were installed. There was no focused characterization of the seepage as the construction of the stream channels and associated excavation occurred in the flood plain, within work areas isolated from gravity drainage by progressive diversions and pumps. Accordingly, it has been impossible to characterize post construction water quality from the compost vaults as they are integrated into the interstitial drainage to the stream and have no defined outlet. Temporal stream water quality improvements since construction and non-impairment of water flowing proximate to these areas of the restored stream are measures of efficacy. In Ellis Branch, slag and other mine waste drained directly to the stream. Clay barriers were installed on the banks of the stream and extensive waste removals were performed well below the elevation of the undisturbed (but impacted) stream bed. The waste material was replaced with “compost vaults” and drainage from these subsurface structures was directed to the receiving steam at a specific interval, and contributes an unmeasured, uncharacterized flow to the stream. No formal attempt to characterize the drainage after removal or reclamation was possible, as all drainage was subsurface after construction. Temporal stream water quality improvements since construction and non-impairment of water flowing proximate to these areas of the undisturbed stream are measures of efficacy.
B.13.3 System Design
The McPherson Demonstration Wetland was designed for flexible treatment of the base flow of McPherson Branch. Sediment laden storm water (generally with lower concentrations of metals) was allowed to bypass the wetland. This prevented inundating the wetland and associated desirable subsurface reactions with sediment. A pinch valve in a pipe through the dam regulates the water level behind the dam and into the wetland. A Geotextile Clay Liner was placed over waste material and associated native underlying alluvium and a two acre anaerobic wetland was constructed that provided for alternate flow paths through the system.
Flow from the stream enters a rock pool at the upstream end of the system, and flows through the limestone bed under the humic strata (square hay bales overlain with mushroom compost). The flow is collected at the downstream end of the system by a PE pipe header and directed to an Agridrain® level control structure. An Agridrain® structure regulates the subsurface flow through the crushed limestone aggregate layer and overlying hay and mushroom compost layers (humic strata). Alternately, the subsurface flow may be reduced by adding stop logs in the Agridrain® and surface flow over the humic strata and planted Typha (cattails) is regulated by an overflow structure. Concrete traffic barriers atop the limestone layer with notches force a serpentine surface flow through the wetland, increasing residence time. Since installation, the flow has typically been subsurface, but the overflow serves to provide a safety measure during unexpected precipitation events. Regulating the water level in the system is accomplished by daily monitoring and occasional adjustment of the pinch valve and the stop logs in the Agridrain®. Figures B.13-2 and B.13-3 illustrate the layout and cross sections of the anaerobic wetland follow.
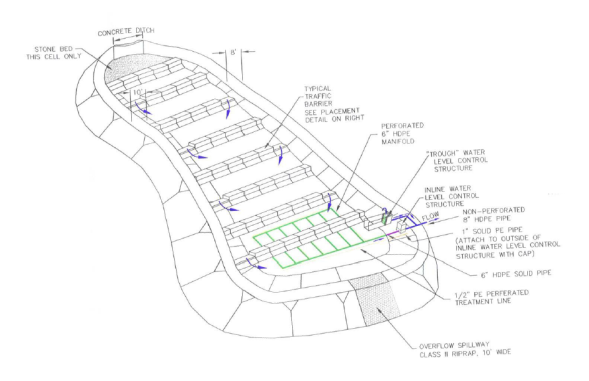
Figure B.13-2. Anaerobic wetland layout.
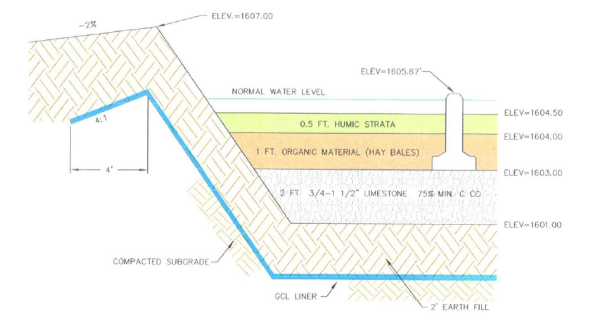
Figure B.13-3. Anaerobic wetland cross-section.
Since chemical reactions augmented by bacterial populations within the limestone bed and humic strata are the mechanisms of contaminant removal, this system is, by definition, a biochemical reactor. The “polishing” wetlands that follow the system are aerobic, as the oxygen deficient effluent from the anaerobic wetland flows over and through the cattail dominated pools. All or a portion of the flow is then introduced subsurface to an un-vegetated bed of crushed limestone and collected in a pipe header where it joins any untreated effluent from the aerobic wetland and discharges to the receiving stream. This “rock filter” removes manganese and other metals from the drainage.
The “compost vaults” are more subtle passive treatment systems and are placed along stream corridors where mine waste removal has been completed. Compost vaults are irregular pits dug with an excavator in selected areas near stream beds that may be impacted by remaining waste materials. In areas where the excavation remains moist (potential groundwater sources), the area is over-excavated and a layer of crushed limestone aggregate is overlain with a layer of spent mushroom compost. This combination of materials was determined to be effective in ameliorating site specific contaminants in extensive static and dynamic bench scale testing. The vault collects drainage, removes and sequesters metals, and conveys it downgrade to the hyporheic zone and ultimately the stream channel. Typical x-sections follow.
B.13.4 BCR Performance
McPherson Wetland performance has been tracked since August 2003. The performance indicators are key metals as well as acidity, sulfate and pH. Table B.13-1 provides a summary of average influent and effluent (from each component) over the period between August 2003 and February 2012.
|
Anaerobic Influent |
Anaerobic Effluent |
Aerobic Effluent |
Rock Filter Effluent |
System Outlet |
|
|---|---|---|---|---|---|
|
Parameter |
402 |
403W |
406 |
420 |
440/440A |
|
Aluminum (dissolved) |
764 |
29.3 |
19.9 |
21.3 |
16.5 |
|
Copper (dissolved) |
136 |
5.6 |
3.2 |
2.2 |
3.3 |
|
Iron |
203 |
992 |
567 |
78.8 |
153 |
|
Iron (dissolved) |
136 |
746 |
86.6 |
24.9 |
20.5 |
|
Manganese (dissolved) |
1231 |
1101 |
867 |
54.5 |
188 |
|
Zinc (dissolved) |
591 |
242 |
327 |
63.3 |
130 |
|
Acidity |
7.9 |
3.9 |
NM |
NM |
0.7 |
|
Sulfate |
124 |
109 |
98 |
108 |
116 |
|
pH |
4.9 |
7.0 |
7.0 |
7.2 |
7.2 |
|
Notes: Metals units = μg/L; Acidity and sulfate = mg/L |
|||||
The following provides detailed discussions of the treatment performance over time for each performance indicator.
B.13.4.1 Dissolved Aluminum
-
402 to 403w
The anaerobic unit (402 to 403w) removed dissolved aluminum on average over the monitoring period (mean 47%/median 97%) with none of 58 403w results exceeding 100 μg/L. No seasonal patterns were evident in the removal efficiency evaluation.
Prior to late 2006, removal efficiencies were consistently above 90%. Influent aluminum concentrations dropped from over 1 mg/L to less than 0.3 mg/L after completion of stream reconstruction downstream of the former McPherson Branch railroad wye in late 2006. Correspondingly, removal efficiency also declined and became more variable with occasional minor additions observed. The pattern was attributable in part to reduced influent concentrations and effluent results often bounded by the detection limit. Average influent dissolved aluminum concentrations trended up after late 2009 (possibly associated with decreased in-stream treatment above 402), and removal efficiency also rebounded.
-
Overall
The overall acid mine drainage AMDacid mine drainage demonstration wetland system consistently removed dissolved aluminum over the monitoring period (mean 75%/median 98%) with none of 63 effluent results exceeding 100 μg/L. No seasonal patterns were evident in the removal efficiency evaluation.
Until late 2006, removal efficiencies were consistently above 95%. After that time, removal was more variable although it remained above 75% on average since December 2008 with one exception. The pattern was attributable in part to reduced influent concentrations and effluent results often bounded by the detection limit.
B.13.4.2 Dissolved Copper
- 402 to 403w
-
The anaerobic unit (402 to 403w) removed dissolved copper on average over the monitoring period (mean 96%/median 98%), and in only three instances was the efficiency less than 90% (minimum 62%). Seasonal patterns were evident prior to December 2006 with lower removal efficiency during winter months. During that period, 403w concentrations ranged up to 64 μg/L.
In late 2006, influent dissolved copper concentrations dropped from an average of around 200 μg/L to below 100 μg/L after completion of stream reconstruction downstream of the former McPherson Branch railroad wye. From that time forward, removal efficiency was consistent (above 90%) with no seasonal changes.
Overall
The overall AMDacid mine drainage demonstration wetland system consistently removed dissolved copper over the monitoring period (mean 97%/median 98%). Seasonal and temporal patterns for the overall system were comparable to those observed for the anaerobic unit although some limited additional removal was achieved in downstream units. The effluent dissolved copper concentration did not exceed 10 μg/L after December 2006 and removal efficiency exceeded 90% except when influent concentrations were notably low.
B.13.4.3 Total Iron
-
402 to 403w
The anaerobic unit (402 to 403w) consistently added total iron over the monitoring period. The amount of addition dropped during the winter months and the discharge (403w) concentration was often above 1000 μg/L.
The seasonal pattern is thought to be associated with enhanced reducing conditionsA system in which the gain of electrons is energetically favored due to a low reduction potential. (iron solubilized) when influent and ambient temperatures were higher during the summer months.
-
Overall
The overall AMDacid mine drainage demonstration wetland system generally provided some net removal of total iron (mean 35%/median 37%) although the overall system occasionally had some net addition. Overall total iron removal also exhibited a seasonal pattern although less prominent than observed in the anaerobic unit alone. Effluent concentrations did not exceed 1000 μg/L, and were typically less than 300 μg/L.
Positive average removal rates and effluent concentrations indicate that the aerobic and/or rock filter units provided some total iron removal benefit.
B.13.4.4 Dissolved Iron
402 to 403w
The anaerobic unit (402 to 403w) added dissolved iron with few exceptions over the monitoring period. Similar to total iron, the amount of addition dropped during the winter months and the discharge (403w) concentration was often above 1000 μg/L.
The seasonal pattern is thought to be associated with enhanced reducing conditions (iron solubilized) when influent and ambient temperatures were higher during the summer months. Influent acidity and iron dropped in late 2006 after completion of stream reconstruction downstream of the former McPherson Branch railroad wye. After that time, the removal efficiency also declined although this was attributable in part to reduced influent concentrations and effluent results were often bounded by the detection limit.
Overall
The overall AMDacid mine drainage demonstration wetland system generally provided some net removal of dissolved iron (mean 64%/median 83%). No obvious seasonality was observed. Effluent concentrations were consistently at or below 100 μg/L over the monitoring period.
Prior to late 2006, the overall system consistently reduced dissolved iron. After December 2006, however, the removal efficiency decreased although this was attributable in part to reduced influent concentrations and effluent results often bounded by the detection limit. When influent concentrations rose in early 2011, overall dissolved iron removal also rebounded. Positive average removal rates and effluent concentrations indicate that the aerobic and/or rock filter units provided some dissolved iron removal benefit.
B.13.4.5 Dissolved Manganese
402 to 403w
Dissolved manganese removal in the anaerobic unit (402 to 403w) was with few exceptions below 50% and frequently less than 25% (average 3%/median 9%). Prior to June 2007, dissolved manganese additions were fairly common in the unit. After that time, however, some removal did occur; generally in excess of 40%.
Seasonal trends were apparent prior to May 2007 with higher removal rates during warmer periods. Influent dissolved manganese concentrations did not change appreciably (on average) after completion of the stream reconstruction downstream of the former McPherson Branch railroad wye but did show greater variability.
Overall
The overall AMDacid mine drainage demonstration wetland system consistently removed dissolved manganese over the monitoring period (mean 83%/median 94%). Seasonal trends were apparent prior to 2007 with lower removal rates (less than 30%) during winter months bottoming out in March 2005 when a slight addition was indicated. From 2007 to early 2012, however, little seasonal variability was observed and overall removal rates were sustained at or above 80% throughout the year. It should be noted that only a fraction of the total flow was routed to the rock filter under most circumstances; controlled by the unit’s hydraulic capacity. Overall manganese removal efficiency was heavily dependent upon flow distribution with higher rates evident during periods of relatively low influent flow.
B.13.4.6 Dissolved Zinc
402 to 403w
The anaerobic unit (402 to 403w) removed dissolved zinc on average over the monitoring period (mean 59%/median 86%). Removal rates were typically greater than 90% although exceptions were noted during winter months. Minimum removal rates were usually observed during January or February; typically less than 25% with negative values (additions) common. During late spring through early fall, effluent (403w) concentrations were consistently below 100 μg/L but ranged as high as 1000 μg/L during the colder months.
From June 2007 to September 2009, the cold weather pattern was not observed and removal rates were consistently above 85%. That period was characterized by lower average influent flow and presumably higher anaerobic unit retention times, and immediately followed completion of stream reconstruction downstream of the former McPherson Branch railroad wye. Influent zinc concentrations have been lower on average since stream reconstruction albeit variable between sampling events.
Overall
Dissolved zinc removal patterns for the overall AMDacid mine drainage demonstration wetland system were similar to those observed for the anaerobic unit. The removal rate was higher (average 77%/median 90%) and seasonal fluctuations were less extreme. Net addition for the overall system was observed during winter 2006, 2007 and 2010 only. From June 2007 to September 2009, the cold weather pattern was not observed and removal rates were consistently above 90%. The sustained high over winter removal rates corresponded with the period of lower average influent flow discussed above.
The patterns indicated additional removal after the anaerobic unit attributable to the aerobic and rock filter units.
The seasonal metals/acidity/sulfate/dissolved oxygen (DO) removal, ORP and alkalinity addition patterns could be attributable to colder temperatures (ambient and influent) which would affect bacterial activity and/or flow as it peaked during the winter months. For the latter, there does appear to be some correlation between peak flow and the magnitude of performance drops.
B.13.4.7 Acidity
The evaluation of acidity removal in the AMDacid mine drainage Demo wetlands was based upon calculated values. Laboratory acidity results were found to be inconsistent and data quality checks identified potential discrepancies in many instances. Calculated acidity data are presented in Table 7.1.
402 to 403w
The anaerobic unit (402 to 403w) removed acidity on average (average 46%/median 56%) over the monitoring period. Prior to September 2006, the acidity removal rate consistently exceeded 50%. Upon completion of the stream reconstruction downstream of the former McPherson Branch railroad wye in late 2006, influent acidity concentrations abruptly dropped by 50% restabilizing in the 3 to 5 mg/L range. Over the next six months, small acidity additions were indicated. From September 2007 to early 2012, acidity removal was highly variable (but always positive) with maximum rates during winter months.
Overall
The overall AMDacid mine drainage demonstration wetland system removed over 80% of influent acidity with few exceptions (average 91%/median 93%). The lowest removal rates (as low as 68%) were observed during the winters of 2004 and 2005 corresponding with maximum flow rates through the system. After September 2006, effluent acidity concentrations were consistently below 1.2 mg/L. The patterns indicated that the aerobic and rock filter units were vital for effective acidity removal.
B.13.4.8 Sulfate
-
402 to 403w
Sulfate removal in the anaerobic unit (402 to 403w) was less than 20% (average 6%/median 4%) with few exceptions. Seasonal trends were observed with maximum removal during summer months. Sulfate additions were commonly observed during winter months. The maximum removal occurred during the summers of 2007 and 2008 (up to 45%) and corresponded with the lowest influent flows over the monitoring period.
-
Overall
The overall AMDacid mine drainage demonstration wetland system sulfate removal rates and patterns were nearly identical to those observed for the anaerobic unit. There was little indication that the aerobic or rock filter units provided any appreciable sulfate removal.
B.13.4.9 pH
-
402 to 403w
The anaerobic unit (402 to 403w) consistently raised pH from an average of 4.9 s.u. (median 4.5 s.u.) to 7.0 s.u. (median 7.0 s.u.). No seasonal trends were observed.
In late 2006, influent pH rose from the 3.5 to 4.5 s.u. range to above 5 s.u. (with few exceptions) after completion of stream reconstruction downstream of the former McPherson Branch railroad wye in late 2006. Prior to September 2006, the pH change through the unit averaged around 2 s.u., but was closer to 1 s.u. afterward.
-
Overall
The overall AMDacid mine drainage demonstration wetland system exhibited patterns comparable to those observed for the anaerobic unit. During most events, overall system effluent pH was slightly higher (average 7.2 s.u./median 7.4 s.u.) than that observed at 403w indicating additional benefits were provided by the aerobic and rock filter units.
B.13.5 BCR Monitoring
The McPherson Demonstration Wetland monitoring program was initiated after approximately 3 weeks of stabilization and implementation continues with approved modifications Key monitoring locations are:
- 402 - Influent to the anaerobic wetland
- 403w - Effluent from the anaerobic wetland and influent to the aerobic wetland
- 406 - Effluent from the third aerobic detention cellAn individual unit in a treatment system. and influent to the rock filter
- 420 - Effluent from the rock filter and influent to RSS
- 440/440A - System outlet
Between August 2003 and February 2012, monitoring efforts included:
-
Daily monitoring of water levels in the anaerobic wetland and diversion dam
- Weekly field monitoring of flow, temperature, pH, specific conductance, DOdissolved oxygen concentration and % saturation, and oxidation/reduction potential (ORP) for the first year. Changed to monthly in August 2004 with the exception of water levels (flow) and pH which are still measured weekly. Further reduction in sampling frequency was approved in 2007, 2008 and 2009.
-
Biweekly field analysis of manganese and sulfide for the first year.
- Monthly laboratory analysis of the following parameters the first year: pH, alkalinity, acidity, sulfate, hardness, biochemical oxygen demand (BOD5), total organic carbon (TOC), total suspended solids(TSS)The weight of material able to sediment out of a stated volume of water. The amount of suspended solids is usually determined by filtering water through a pre-weighed 0.45-μm pore-diameter filter, drying the filter to constant weight, and determining the mass gained., total dissolved solids (TDS), aluminum, calcium, cadmium, cobalt, copper, iron, lead, manganese, selenium, sodium, and zinc. Metals are analyzed for both total and dissolved concentrations. Request approved in August 2004 to eliminate BOD5, TOC, TDS, and selenium from the monthly analysis for all locations and eliminate other parameters for certain locations. This was eliminated by subsequent monitoring revisions. These field parameters were included in the quarterly and semi-annual monitoring efforts below.
- Quarterly laboratory analysis of wetland inlet (402) and system outlet (440/440A) initiated in March 2009
- Semi-annual laboratory analysis of anaerobic outlet (403w) initiated January 2010 per TDEC approval.
- 402 and outlet as part of BBC WS study since June 2011
Currently, monitoring at the McPherson Demonstration wetland includes:
- Daily monitoring of water levels in the anaerobic wetland and diversion dam
- Weekly field monitoring of flow and pH at all points
- Quarterly (March, June, September, December) laboratory analysis of wetland inlet (402) and system outlet
- Field monitoring and laboratory analysis of 402, 403W and outlet (440/440A) during January and July.
B.13.6 Regulatory Challenges
Due to the unique regulatory framework guiding the remedial programs in the Lower North Potato Creek watershed, there have been relatively few challenges. Since initial agreements were reached in January 2001, GSHI, USEPA, TDEC and project contractors have held bimonthly technical status meetings. This forum has been used to present technical data, discuss strategies for remedial actions and resolve issues associated with potential conflicts between adaptive management –based decisions and regulatory requirements. As a result, all parties have had the opportunity to voice opinions and provide technical input while maintaining perspective on the merits of individual actions (such as passive treatment) in light of overall projective objectives.
B.13.7 Stakeholder Challenges
As mentioned above, regulatory stakeholders have had a voice throughout the process. The local community has been kept informed of activities through a series of public meetings. GSHI is well-regarded in the community.
B.13.8 References
Faulkner, Ben B., Miller, Franklin. 2010. Land and Water Reclamation of the Copper Basin of TN in 2010 Symposium Proceedings American Society for Mining and Reclamation, Pittsburgh,PA http://www.asmr.us/Publications/Conference%20Proceedings/Conference%20Proceedings.htm
Miller, Franklin, Faulkner, Ben. 2008. Land and Water Reclamation of the Copper Basin of TN in Proceedings of USEPA/National Ground Water Association Workshop, Denver, CO. http://ngwa.confex.com/ngwa/mine08/webprogram/start.html
Faulkner, Ben B. et al. 2007. Bench-Scale Testing of a Sulfate-Reducing Bacteria Treatment of Copper Basin, TN Mine Drainage in WVDM Task Force Symposium Proceedings. http://www.wvmdtaskforce.com/proceedings/07/Faulkner-2007-TF.pdf
Publication Date: November 2013